Categories
Data Graphs Politics Scale Measurement Thoughts

How should we unpack? – 2020 Election

The election we’re having in 2020 is going to be important for countless different reasons but the main thing that’s going to be on peoples mind is going to be COVID-19. Not November 3rd but Oct 9th, 18th, and the 27th, the three weeks prior to the election. If this was a court of law, the evidence would be circumstantial but also past the point of the severity. It would cross a threshold where any standard of deviation doesn’t change the grim picture ahead. While COVID-19 is now begun to being an endemic virus, this is not thing to simply ignore for the populations health and the way that compounds to higher rates of death. Some of what we’ve learned gives us a better glimpse to what we can expect regarding the outcomes of the virus spread. One is that it is rapid and can take days to develop symptoms but with that is deaths lag so don’t fall for rising infections without deaths. We know three-four weeks out of a surge of infections do the deaths begin to add up and we begin to tally them.

First is to look outside to what can be learned for most countries to understand our outlandish position. India has peaked for now but shows the immense risk for their populations. Europe is currently in their second wave, which began to really show itself the end of August. Spain, France, and the Untied Kingdom cases are rising dramatically and providing proof to the theory of the second wave being worse than the first. Mexico is trending upwards and while Brazil’s trends are falling right now, they’re outcomes vary greatly. Lastly, is that Germany seems to be the model not our neighbors to the north. Canada’s cases are starting to resemble the rises Spain and France were beginning to see a month ago.

Coming back home, cases on a whole have begun to rise, but not at the same rate as the European countries in particular are experiencing their second waves. We cannot measure the space the United States is in through the same way we analyze them because they’re statistical profile is so different, highlighted during the summer, you cannot glean the same outcomes in response to COVID-19. Where it’s relative is we really need to understand the scale of the current rise of cases in the United States. The fear is our second wave of the virus can look a lot more catastrophic compared to what these other countries are facing now. Let’s take the analogy of the pandemic waves and think of it literally. The data can represent the crests of the first waves.

The number’s can be used to represent how many cm of height to a wave.
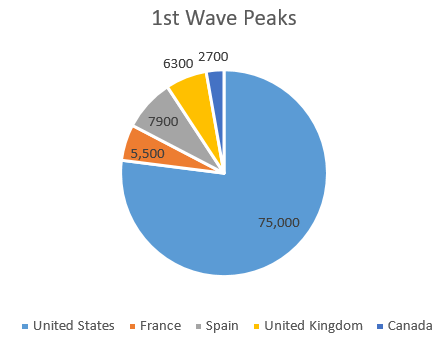
ex: America’s wave would be 750m high compared to Canada’s 27m high.
Current day waves where the same rule can apply.
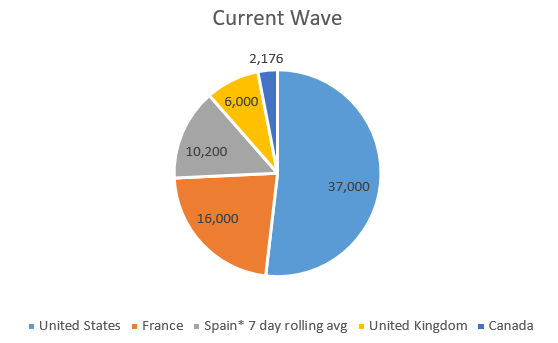
Ex. America’s wave would now be 370m high compared to Spain’s 102m
This is with an outlier day reported in Spain on September 28th.
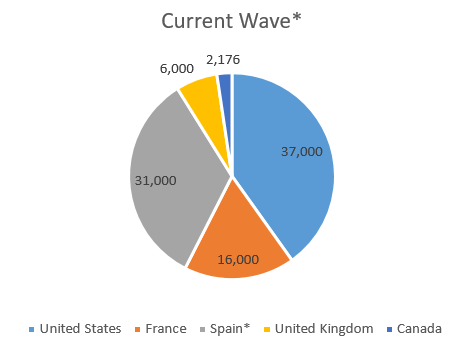
Ex. Spain’s wave would now be 310m high compared to the 102m avg.

Now taking out the United States, those other Countries dropped their cases down to a low level for an extended period of time due to their populations preventive behaviors. There’s a clear visible trend to see the rise in cases and be properly concerned to ready yourself once more for being more diligent/militant in those behaviors as they did in March through May/June. The issue with their outcomes and what the United States is that the cases never fell to any discernable level of acceptance to signify the end of a wave.

The situation in America it’s closer to resembling a never ending storm surge that has/had been dropping very slowly. To really understand the current leveling off and stagnation of cases is largely due to behavior in populations and schools holding in-person classes for the wrong age group. For that we need to go to state by state data to know what’s happening beneath the surge for what a second wave looks like for us. Only Arizona, Connecticut, Florida*, Georgia, Louisiana*, NY, NJ, Oklahoma, and Vermont are falling in cases. Twelve other states are stagnant as far as number but that isn’t a good because if the cases have not fallen to low levels like like NY, NJ and Vermont did, that stagnation is not a sufficient and can be viewed in the negative. In the writing of this piece, New York and New Jersey have begun to see their cases rise, Florida’s cases are dropping due to their elderly populations sensitivity to COVID-19. As the dust settles, there are still 40+ states in vulnerable situations where there are 23 states that cases are rising significantly, nine of which are rising in very dramatic levels. Of the 23 states with rising cases, most are almost all rural, but predominantly red states (13 or 56%). While all states were impacted by the first wave, Trump himself made the calculation of looking only at Republican run states as far as judging the response to COVID-19. The issue is that this data is maintaining a stagnation to the already slow falling American cases.

Remembering the first point of the United States having over 80% of the those states are in compromised situations. Next is that due to the issue of the size of our first wave potentially blinding us to and exponential rise in cases which in it’s first iteration or wave, crippled the global economy. Third is that Europe is proving the theory of the second wave being worse than the first wave. In finality, we know that deaths are a lagging indicator so when this begins to really impact a majority of red lead states, there will be a shift. If there’s a coalition of folks who want to have maintained power the data would suggest to, none stop talk about healthcare and the mishandling of COVID-19 by Trump and Conservative leaders. It is not combative to the importance of November 3rd because if that date holds greater importance, the Biden/Harris Campaign or any coalition that wants power would promise and DELIVER on healthcare. It’s really that simple.

Categories
How to unpack? Scale Measurement Thoughts

Can we unpack COVID-19?

Truth be told, I’m not sure what’s going to happen but the trends are not looking great. In some ways you first need the story of the numbers which can now give us a glimpse of what we can expect because some places in the world have gone through a viral cycle of sorts. Now while the context of numbers can be lost on some, I want to share where I’m getting this from Duc C. Vuong. A lot of what of this is will be based off his video(s) late in August. He’s been a great resource all through the pandemic but before we get into the roots, the focus is trying to understand whats happening in the world.

During the first wave* of the pandemic we had no context for the numbers of infected and those who died. On April 1st when Spain and France were the face of the pandemic as Italy was beginning to drop, Spain had 9,700 cases (8,000 7-day avg) and on August 28th, they had almost 9800 cases (7,600 7-day avg). Likewise, France had 4,800 cases (4,500 7-day avg) and just had 7,000 cases (4600 7-day avg) on August 28th. The last piece of context is Italy and at their peak when most of the Western World, sadly, began to emphasize with the people suffering from COVID-19. At their peak they were are over 5,000 cases, sustained for over a week. While not as radical, they’re not at the same pace, cases have begun to rise as they’re climbing above 20% of their countries first peak.

*In America, please read: start. context below

In the United States, there was no end to the first wave… for the understanding of the impacts there.

As for the United States, which never flattened the numbers of cases or deaths to any sort of most of the world achieved as, our outcomes may be the most bleak. Now that we have the context for countries above as to where they stand right now (very bleak), how do we contextualize the space the United States is in. An effective way is to attempt to try and focus on the stories the numbers are telling us based on the past six months. Now while I am political this is about empathy as sad or pathetic as that might sound. On the chance anyone outside of my world has a chance to see this and maybe live would be the context above for the analysis below.

There are a few things we can glean from past to give us an idea of the numbers for tomorrow. First would be that the second wave is worse than the first. For countries like Spain and France, unless behavior curbs dramatically, they can see case numbers two to three fold of the first wave. If Italy was on the brink at 5,000 cases a day for a week, what happens if the second wave peak is at 12,000 cases a day? Will their systems collapse and what would that do to all cause mortality? How much non-direct death will be caused from the sheer scale of COVID (3.4% death rate globally: 8-30-2020)? Will there be enough treatment through therapies, or a vaccine by some miracle, to help bring outliers in death rate closer to the mean? Will it be significant enough to combat the pressure that volume of cases puts on their medical systems? Those are the kind of questions Europeans should be asking themselves right now if there’s any way to stymie the second wave begin to crash, west to east.

If those are the questions Europe what are the ones Americans face? What questions give us the context of what’s in front of us? In some ways our adversity is similar, but also quite different. While the scale paints a picture of a death rate between 3 -4% globally, that is not how the United States measure the current crisis. If you took the deaths of Spain (29,000), Italy (35,000), and France(30,000) and compare that to the United States alone the United States during the same period, we still double the deaths. By a factor of 2:1 of COVID mortality since the pandemic began on not a 1:1 comparison, but a 1:3 instead. Simply put, the only way I can contextualize COVID in America is doing what you can to prevent death. How much? It’s not even quantifiable but when we begin to realistically cross into a conversation of being too cautious, maybe that’s when we can find the value of how much or for how long. It’s not relevant when we can’t even prevent the death occurring in this country.

The idea that between 15,000 & 20,000 cases a day before we collectively thought we needed to close schools. Opening them will allow the virus to grow exponentially more than if schools waited a semester especially based on how much worse the loss of life has been in the States. The haphazard decision to open schools by the white house and that being at around 40,000-50,000 cases a day now, how do you begin to reconcile closing them before 20,000 daily cases and opening them before they fall below even 40,000.

Not only do the decisions bare skepticism relating to safety and caution, but the numbers also paint the American reality is worse than the very bleak outlook for Europe. Can the United States rapidly change the behavior of the people? Will there be a fundamental change as far as the white houses approach to COVID? If the numbers of cases can grow as Spain and France are projected above, has the number of people infected potentially limit the growth due to the scale of those already infected? Certainly the United States will have a new peak, but since the first wave never ended, there’s less certainty that can be drawn.

To round out the view Americans should adopt to accomplish as much prevention of death is difficult as our scenario is so different. Personally I believe that sharing our fears and emotions in this moment could be a start (virtually). Outside of that, keeping circles of peoples those whom you truly consider family physically and communicate remotely whether for work or your friends whom are outside of that and be empathetic. This is going to be very dark. Things are going to get worst. As far as death we’re top of the charts and it’s not close. With that, keep in contact with your friends and loved ones. Maintain the distance when in social spaces and do what you can to protect your mouth and nose from either spreading or contracting the virus. In short, wear your masks, wash your hands, and form preventive habits to give you and your family the best chance for lessened pain.

~Stay safe